Home /
Electrical Vector of the Heart
Heart electrical vector, depolarization and repolarization
Working Myocardium
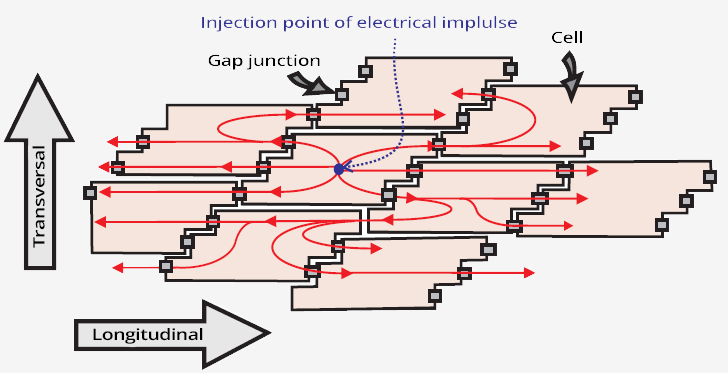
Action Potential and Working Myocardium
- In the image, there are cardiomyocytes of the working myocardium.
- At rest, all cardiomyocytes are polarized.
- Due to uneven ion distribution, the extracellular environment has a positive electrical charge.
- Extracellularly, there is a high concentration of Na+ ions.
- Cardiomyocytes form a syncytium.
- They are interconnected by intercalated discs through which ions rapidly transfer.
- Upon stimulation of a cardiomyocyte by an impulse, the action potential spreads to neighboring cells.
- Similar to throwing a stone into water (from the center outward).
- Cardiomyocytes depolarize.
- The extracellular environment becomes negative.
- The action potential spreads:
- Rapidly - longitudinally
- Slowly - transversely
- Because intercalated discs are located on the lateral sides of cardiomyocytes.
Propagation of Action Potential
Propagation of Action Potential
- Action potential originates spontaneously in the SA node
- During the spread of the action potential through the working myocardium, a depolarization wave occurs (blue wave in the video)
- The depolarization wave (extracellular environment becomes negative) propagates through the myocardium in the following order:
- After depolarization, repolarization of the ventricles follows (extracellular environment becomes positive)
- Ventricular repolarization (red wave in the video) progresses from epicardium to endocardium (T wave)
- Atrial repolarization is not visible on the ECG
- The principle of the ECG curve is simple, if depolarization is directed: (blue wave in the video)
- Towards the ECG lead - a positive deflection (wave) is generated
- Away from the ECG lead - a negative deflection (wave) is generated
- Ventricular repolarization (red wave in the video)
- Progresses from the ECG leads and creates a positive T wave
- Because depolarization and repolarization have the same electrical direction
Electric Vector and ECG
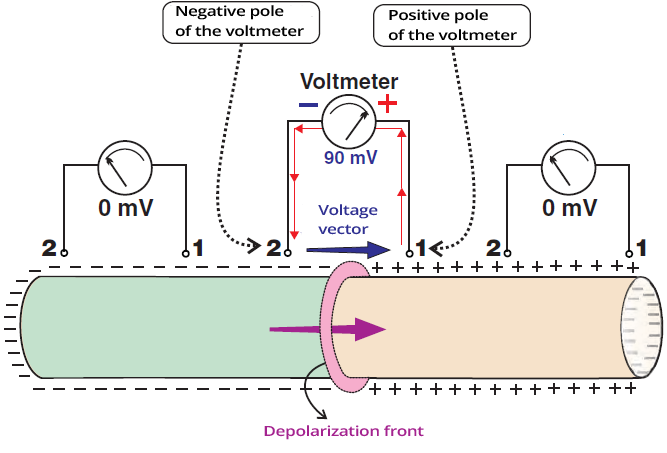
Working Myocardium and Electric Vector
- The image shows a portion of the working myocardium (not a single cardiomyocyte)
- Volt is the voltage between 2 electrodes
- The ECG device has electrodes on the surface of the body
- Voltmeter shows electrical voltage if:
- One electrode is over depolarized (-) part
- The other is over repolarized (+) part of the myocardium
- The ECG device displays volts as waves and deflections
- Voltmeter shows 0 mV value
- If both electrodes are above depolarized (-) or repolarized (+) myocardium
- Voltmeter shows 0mV because there is no electrical voltage between the electrodes
- On the ECG, it represents the isoelectric line
- Electric Vector
- Always directs from negative (-) to positive (+) extracellular part of the myocardium
- If the electric vector is directed
- Towards the ECG lead - it creates a positive deflection (wave)
- Away from the ECG lead - it creates a negative deflection (wave)
Depolarization and ECG
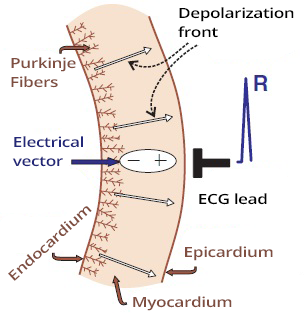
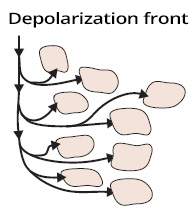
Spread of Depolarization Wave and ECG
- Depolarization wave (extracellular change from + to -) spreads in the myocardial wall from endocardium to epicardium
- The electric vector always directs from (-) to (+) part of the myocardium
- The depolarization wave spreads very rapidly
- Because sodium channels open rapidly at the beginning of action potential in cardiomyocytes
- The depolarization wave directed towards the ECG electrode
- Creates a narrow positive deflection
- The deflection is narrow because depolarization occurs very quickly
- The width of R wave represents the time during which the ventricles depolarize
Repolarization and ECG
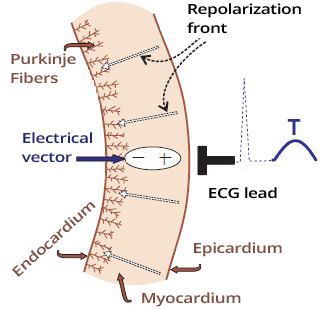
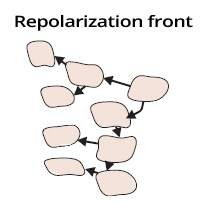
Spread of Repolarization Wave and ECG
- Repolarization wave (extracellular change from - to +) spreads in the myocardial wall from epicardium to endocardium
- Because epicardium starts repolarizing earlier
- The wave has opposite direction compared to depolarization
- However, the electric vector always directs from (-) to (+) part of the myocardium
- The electric vector has the same direction during both depolarization and repolarization
- The repolarization wave spreads slowly
- Because calcium and potassium channels open slowly at the end of action potential in cardiomyocytes
- The repolarization wave is directed from the ECG electrode, but the electric vector directs towards the ECG electrode
- Repolarization occurs more slowly, resulting in a broad T wave
- The width of T wave represents the time during which the ventricles repolarize
Depolarization and Repolarization of Myocardium
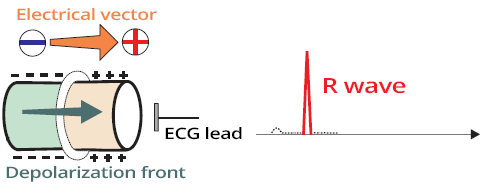
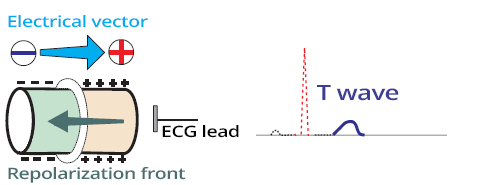
Depolarization and Repolarization of Myocardium
- Depolarization and repolarization waves have opposite directions
- However, the electric vector always has the same direction
- Depolarization occurs rapidly
- Repolarization occurs more slowly
Action Potential in Endocardium and Epicardium

Action Potential in Endocardium and Epicardium
- Action potential of cardiomyocytes in endocardium and epicardium has different electrical properties
- The conduction system activates myocardium in the endocardium
- Thus, depolarization begins in the endocardium
- Depolarization in endocardium and epicardium is nearly synchronous
- Therefore, the depolarization wave propagates rapidly through the myocardial wall
- Cardiomyocytes in the epicardium start repolarizing earlier than those in the endocardium
- Hence, repolarization wave begins in the epicardium
- The electrical vector of depolarization and repolarization, however, has the same direction
Action Potential and Contraction of the Cardiomyocyte
- Action potential in the working myocardium
- Causes a sequential contraction of all cardiomyocytes
- Because the working myocardium is a syncytium
- Action potential is generated spontaneously
- In the SA node and then propagates through the conduction system
- From the conduction system, it transfers to the working myocardium
- It generates a atrial systole and then a ventricular systole
Main Ventricular Vector
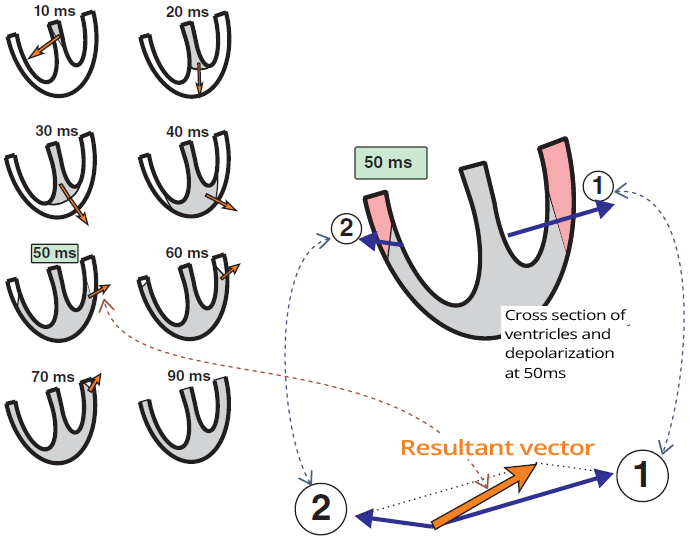
Main Ventricular Vector
- The ventricles depolarize sequentially
- Ventricular septum (Q wave)
- Ventricles (R wave)
- Base of the left ventricle (S wave)
- The depolarization wave has a specific direction and sequentially depolarizes the entire ventricles
- The direction of the resultant electrical vector changes during depolarization
- The ECG curve shows the resultant electrical vector over time
- At 50ms, the left and right ventricles are synchronously activated
- The electrical vectors diverge from each other
- The left ventricle vector is larger (due to the left ventricle being more massive)
- Thus, the resultant vector of ventricular depolarization is directed in the direction of the left ventricle
- Main cardiac vector
- It is the electrical vector of left ventricular depolarization (and right)
- The right ventricle vector is small and has little influence on the direction of the left ventricle vector
- It is the largest and creates the R wave on the ECG
- The size and direction of vectors over time is a vectorcardiogram
Ventricular Vectors
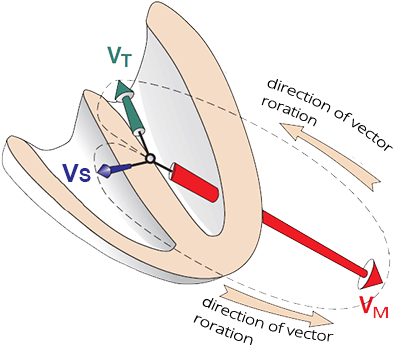
- First, the thin ventricular septum is activated
- Creating a small septal vector (VS)
- Then, the massive left ventricle is activated
- Creating a large main vector (VH)
- Simultaneously, the thin right ventricle is also activated
- Small right ventricle vector
- Does not influence the direction of the main vector
- Finally, the base of the left ventricle is activated
- Creating a small terminal vector (VT)
- You must imagine the vectors in 3D space
ECG and Ventricular Vectors
- The ventricles are activated sequentially:
- Ventricular septum (VS - septal vector)
- Left and right ventricles (VM - main vector)
- Base of the left ventricle (VT - terminal vector)
- QRS complex appears differently in each lead
- Because each lead "views" the vectors from a different angle
- If the vector is directed
- Towards the lead - creates a positive deflection
- Away from the lead - creates a negative deflection
- Ventricular depolarization (QRS complex) is shown in the images
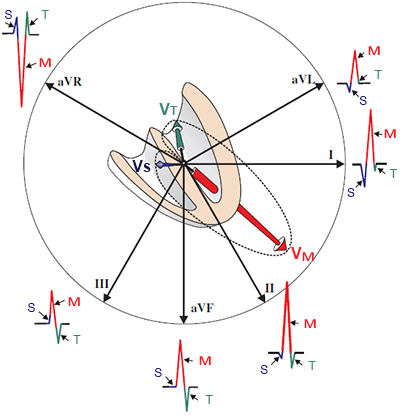
Limb Leads
- "View" the vectors in the frontal plane
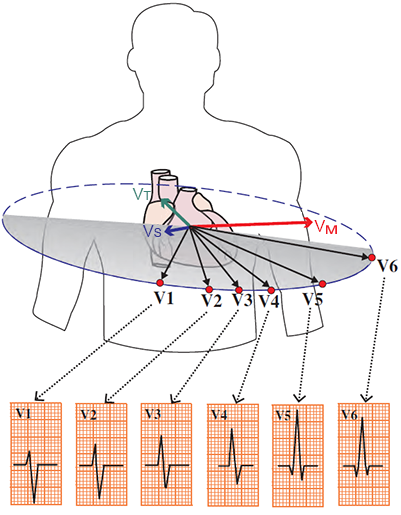
Chest Leads
- "View" the vectors in the horizontal plane
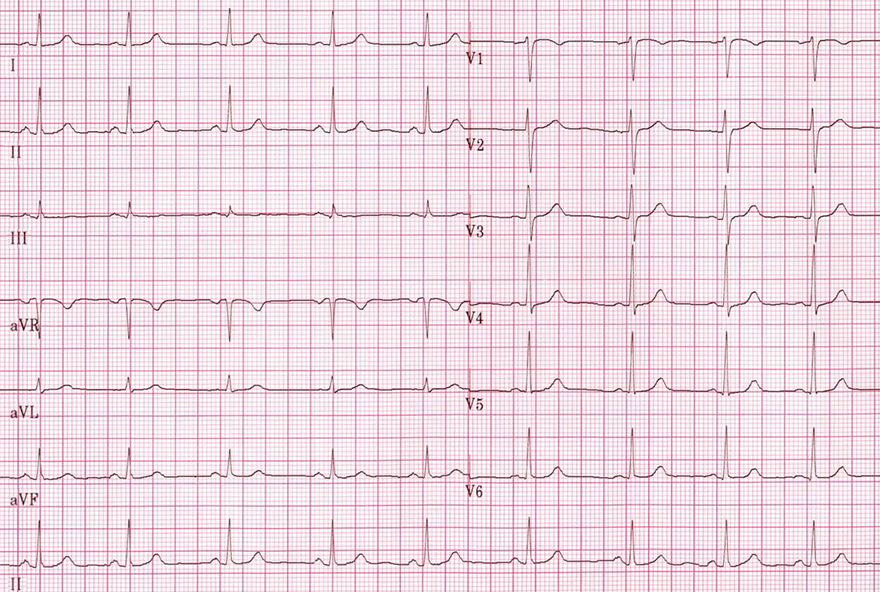
Sinus Rhythm
- The ECG shows a sinus rhythm
- Notice how the height of the QRS complexes varies in different leads
Sources
- ECG from Basics to Essentials Step by Step
- litfl.com
- ecgwaves.com
- metealpaslan.com
- medmastery.com
- uptodate.com
- ecgpedia.org
- wikipedia.org
- Strong Medicine
- Understanding Pacemakers


