Home /
Laddergram - ECG
Laddergram
ECG and Electrical Impulse

- ECG curve illustrates the propagation of impulses through the heart
- Impulse propagates
- The ECG curve mainly displays:
- Slow propagation of the impulse in the working myocardium
- The impulse creates a cardiac vector in the working myocardium
- Electrical activity in the atrial myocardium creates:
- P wave (atrial depolarization)
- Ta wave (atrial repolarization)
- is hidden within the QRS complex
- Electrical activity in the ventricular myocardium creates:
Laddergram

- It is a graph that shows the conduction of an impulse through the conduction system
- It is used for interpretation and better understanding of complex arrhythmias
- Sometimes on an ECG we do not see the conduction of the impulse
- Reading and understanding a laddergram is simple
- It is more difficult to draw a laddergram for a complex arrhythmia
Laddergram
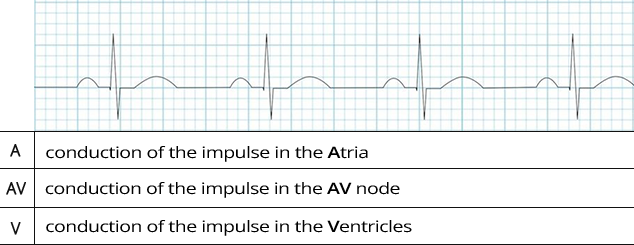
- The laddergram is located below the ECG recording
- It has 3 bands:
- A (Atria): shows the conduction of the impulse in the atria
- AV (AV node): shows the conduction of the impulse in the AV node
- V (Ventricles): shows the conduction of the impulse in the ventricles
Sinus Rhythm and Laddergram
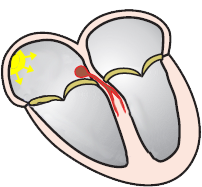
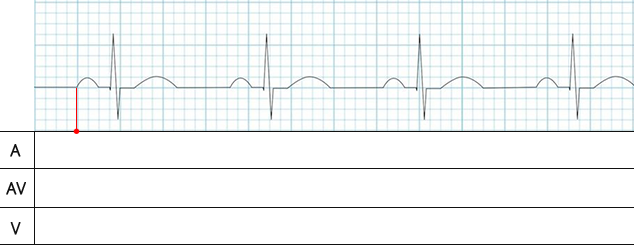
- The red dot on the 1st line indicates the beginning of atrial depolarization (the start of the P wave)
- This is the moment when the impulse exits the SA node and begins to depolarize the atrial myocardium


- The red dot on the 2nd line indicates the beginning of AV node depolarization (the peak of the P wave)
- The atria are activated at the time when the P wave reaches its peak
- Then, the impulse from the atria enters the AV node (red dot on the 2nd line)
- The red line in the A segment of the laddergram represents the propagation of the impulse through the atria
- The time for atrial depolarization is approximately 0.03s

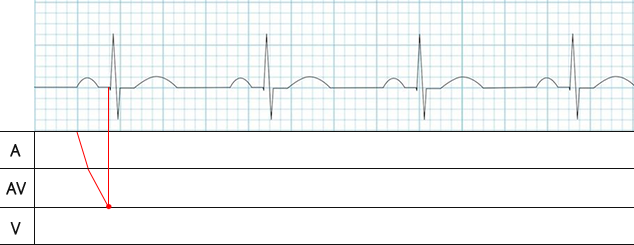
- The red dot on the 3rd line indicates the beginning of ventricular depolarization (the start of the Q wave)
- The red line in the AV segment of the laddergram represents the propagation of the impulse through the AV node
- The impulse is delayed in the AV node for approximately 0.1s, which is longer than in the atria
- Therefore, the line in the AV segment is less steep than in the A segment
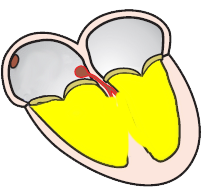
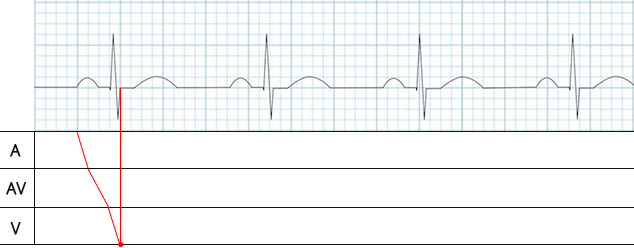
- The red dot on the 4th line indicates ventricular depolarization
- Ventricular depolarization begins and ends with the QRS complex, lasting about 0.1s
- Ventricular repolarization (the T wave) is not shown on the laddergram

Sinus Rhythm (Laddergram)
- A: impulse propagation through the atria
- AV: impulse propagation through the AV node
- V: impulse propagation through the ventricles
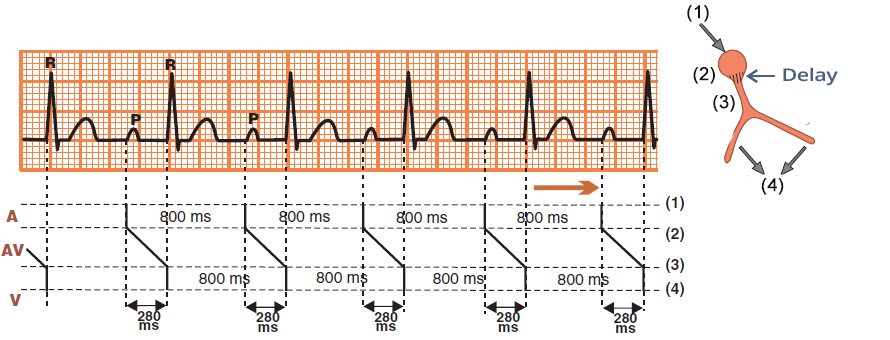
First-Degree AV Block (Laddergram)
- A: impulse propagation through the atria
- AV: impulse propagation through the AV node
- V: impulse propagation through the ventricles
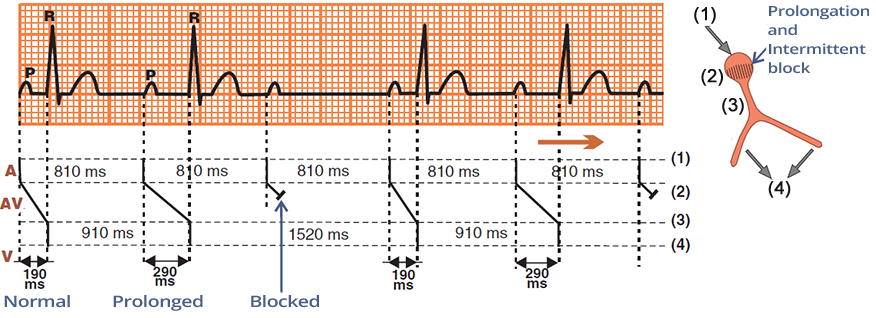
Second-Degree AV Block - Wenckebach (Laddergram)
- A: impulse propagation through the atria
- AV: impulse propagation through the AV node
- V: impulse propagation through the ventricles

Second-Degree AV Block - Mobitz II (Laddergram)
- A: impulse propagation through the atria
- AV: impulse propagation through the AV node
- V: impulse propagation through the ventricles
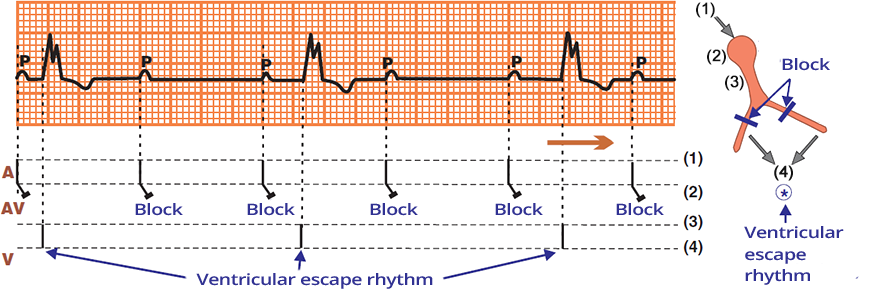
Third-Degree AV Block (Laddergram)
- A: impulse propagation through the atria
- AV: impulse propagation through the AV node
- All impulses from the atria are blocked at the AV node
- This is Third-Degree AV Block (the atria are electrically isolated from the ventricles)
- V: impulse propagation through the ventricles

Ventricular Extrasystole - Complete Compensatory Pause (Laddergram)
- A: The SA node generates impulses regularly (P1-P2 interval: 700ms)
- AV: impulses from the atria are conducted to the ventricles
- V: Ventricular extrasystole (VES) occurs in the ventricles earlier than the expected impulse from the atria
- VES retrogradely propagates to the atria through the AV node
- In the AV node, the VES meets the impulse from the SA node, and the impulses are reset (refractory period)
- A complete compensatory pause follows the VES
- The RR interval with VES (1400ms) is exactly twice the RR interval without VES (2x700ms)
- Because there was no reset of the SA node (The impulse from the VES did not pass to the atria to the SA node)

Ventricular Extrasystole - Incomplete Compensatory Pause (Laddergram)
- A: The SA node generates impulses regularly (P1-P2 interval: 700ms)
- AV: impulses from the atria are conducted to the ventricles
- V: Ventricular extrasystole (VES) occurs in the ventricles earlier than the expected impulse from the atria
- VES retrogradely passes through the AV node to the atria
- The VES impulse resets the SA node, creating a retrograde - negative P wave following a wide QRS complex
- An incomplete compensatory pause follows the VES
- The RR interval with VES (1295ms) is shorter than twice the RR interval without VES
- Incomplete compensatory pause is rare in VES
- Because VES rarely retrogradely resets the SA node

Atrial Fibrillation (Laddergram)
- A: In atrial fibrillation, impulses originate in the atria with a frequency of 350-600/min
- AV: Impulses from the atria bombard the AV node, but the AV node does not conduct every impulse to the ventricles
- V: The ventricles are activated by impulses from the AV node irregularly
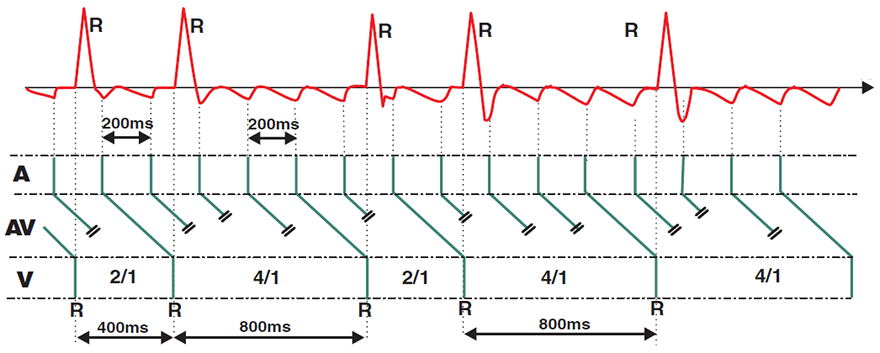
Atrial Flutter (Laddergram)
- A: In atrial flutter, impulses originate in the atria with a frequency of 300/min (60000/200ms)
- AV: The AV node blocks impulses with 2:1 and 4:1 AV block
- V: The ventricles are activated only by impulses that pass through the AV node
Laddergram and Atria


Sinus Rhythm (Atrial Laddergram)
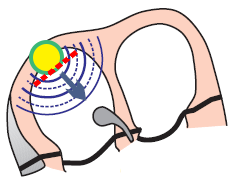
- Atrial laddergram, which is used very rarely
- It has 3 strips:
- S: Represents P cells (SA node), showing the initiation of impulses in the SA node
- SA: Represents T cells (Sinoatrial junction), showing the transmission of impulses from the SA node to the atria
- A: Represents the atria, showing the propagation of impulses through the atria
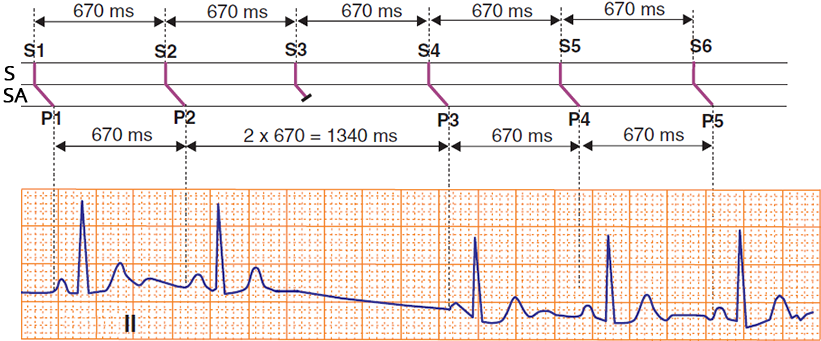
SA Block II Degree - Type II (Laddergram)
- S: The SA node generates impulses regularly (670ms)
- SA: Some impulses are blocked in the SA junction (S3)
Sources
- ECG from Basics to Essentials Step by Step
- litfl.com
- ecgwaves.com
- metealpaslan.com
- medmastery.com
- uptodate.com
- ecgpedia.org
- wikipedia.org
- Strong Medicine
- Understanding Pacemakers
Home /
Laddergram - ECG
Laddergram
ECG and Electrical Impulse
- ECG curve illustrates the propagation of impulses through the heart
- Impulse propagates
- The ECG curve mainly displays:
- Slow propagation of the impulse in the working myocardium
- The impulse creates a cardiac vector in the working myocardium
- Electrical activity in the atrial myocardium creates:
- P wave (atrial depolarization)
- Ta wave (atrial repolarization)
- is hidden within the QRS complex
- Electrical activity in the ventricular myocardium creates:
|

|
Laddergram
- It is a graph that shows the conduction of an impulse through the conduction system
- It is used for interpretation and better understanding of complex arrhythmias
- Sometimes on an ECG we do not see the conduction of the impulse
- Reading and understanding a laddergram is simple
- It is more difficult to draw a laddergram for a complex arrhythmia
|

|

Laddergram
- The laddergram is located below the ECG recording
- It has 3 bands:
- A (Atria): shows the conduction of the impulse in the atria
- AV (AV node): shows the conduction of the impulse in the AV node
- V (Ventricles): shows the conduction of the impulse in the ventricles
Sinus Rhythm and Laddergram
- The red dot on the 1st line indicates the beginning of atrial depolarization (the start of the P wave)
- This is the moment when the impulse exits the SA node and begins to depolarize the atrial myocardium
- The red dot on the 2nd line indicates the beginning of AV node depolarization (the peak of the P wave)
- The atria are activated at the time when the P wave reaches its peak
- Then, the impulse from the atria enters the AV node (red dot on the 2nd line)
- The red line in the A segment of the laddergram represents the propagation of the impulse through the atria
- The time for atrial depolarization is approximately 0.03s
- The red dot on the 3rd line indicates the beginning of ventricular depolarization (the start of the Q wave)
- The red line in the AV segment of the laddergram represents the propagation of the impulse through the AV node
- The impulse is delayed in the AV node for approximately 0.1s, which is longer than in the atria
- Therefore, the line in the AV segment is less steep than in the A segment
- The red dot on the 4th line indicates ventricular depolarization
- Ventricular depolarization begins and ends with the QRS complex, lasting about 0.1s
- Ventricular repolarization (the T wave) is not shown on the laddergram

Sinus Rhythm (Laddergram)
- A: impulse propagation through the atria
- AV: impulse propagation through the AV node
- V: impulse propagation through the ventricles

First-Degree AV Block (Laddergram)
- A: impulse propagation through the atria
- AV: impulse propagation through the AV node
- V: impulse propagation through the ventricles

Second-Degree AV Block - Wenckebach (Laddergram)
- A: impulse propagation through the atria
- AV: impulse propagation through the AV node
- V: impulse propagation through the ventricles

Second-Degree AV Block - Mobitz II (Laddergram)
- A: impulse propagation through the atria
- AV: impulse propagation through the AV node
- V: impulse propagation through the ventricles

Third-Degree AV Block (Laddergram)
- A: impulse propagation through the atria
- AV: impulse propagation through the AV node
- All impulses from the atria are blocked at the AV node
- This is Third-Degree AV Block (the atria are electrically isolated from the ventricles)
- V: impulse propagation through the ventricles

Ventricular Extrasystole - Complete Compensatory Pause (Laddergram)
- A: The SA node generates impulses regularly (P1-P2 interval: 700ms)
- AV: impulses from the atria are conducted to the ventricles
- V: Ventricular extrasystole (VES) occurs in the ventricles earlier than the expected impulse from the atria
- VES retrogradely propagates to the atria through the AV node
- In the AV node, the VES meets the impulse from the SA node, and the impulses are reset (refractory period)
- A complete compensatory pause follows the VES
- The RR interval with VES (1400ms) is exactly twice the RR interval without VES (2x700ms)
- Because there was no reset of the SA node (The impulse from the VES did not pass to the atria to the SA node)

Ventricular Extrasystole - Incomplete Compensatory Pause (Laddergram)
- A: The SA node generates impulses regularly (P1-P2 interval: 700ms)
- AV: impulses from the atria are conducted to the ventricles
- V: Ventricular extrasystole (VES) occurs in the ventricles earlier than the expected impulse from the atria
- VES retrogradely passes through the AV node to the atria
- The VES impulse resets the SA node, creating a retrograde - negative P wave following a wide QRS complex
- An incomplete compensatory pause follows the VES
- The RR interval with VES (1295ms) is shorter than twice the RR interval without VES
- Incomplete compensatory pause is rare in VES
- Because VES rarely retrogradely resets the SA node

Atrial Fibrillation (Laddergram)
- A: In atrial fibrillation, impulses originate in the atria with a frequency of 350-600/min
- AV: Impulses from the atria bombard the AV node, but the AV node does not conduct every impulse to the ventricles
- V: The ventricles are activated by impulses from the AV node irregularly

Atrial Flutter (Laddergram)
- A: In atrial flutter, impulses originate in the atria with a frequency of 300/min (60000/200ms)
- AV: The AV node blocks impulses with 2:1 and 4:1 AV block
- V: The ventricles are activated only by impulses that pass through the AV node
Laddergram and Atria
|

|

Sinus Rhythm (Atrial Laddergram)
- Atrial laddergram, which is used very rarely
- It has 3 strips:
- S: Represents P cells (SA node), showing the initiation of impulses in the SA node
- SA: Represents T cells (Sinoatrial junction), showing the transmission of impulses from the SA node to the atria
- A: Represents the atria, showing the propagation of impulses through the atria

|
SA Block II Degree - Type II (Laddergram)
- S: The SA node generates impulses regularly (670ms)
- SA: Some impulses are blocked in the SA junction (S3)
|

|
Sources
- ECG from Basics to Essentials Step by Step
- litfl.com
- ecgwaves.com
- metealpaslan.com
- medmastery.com
- uptodate.com
- ecgpedia.org
- wikipedia.org
- Strong Medicine
- Understanding Pacemakers


