|
|
ECGbook.com Making Medical Education Free for All |
|
|
ECGbook.com Making Medical Education Free for All |
|
|
ECGbook.com Making Medical Education Free for All |
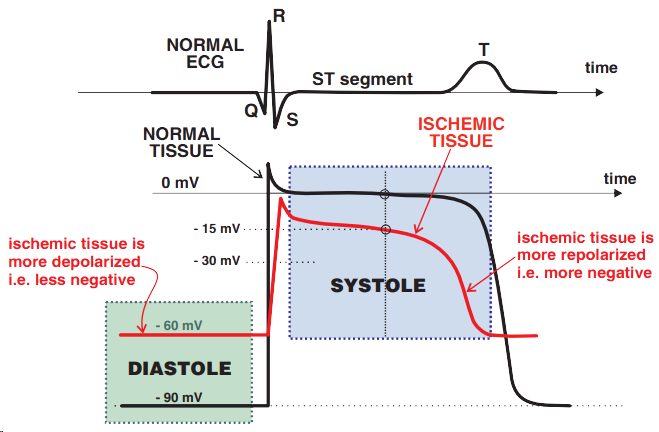
Ischemia During Diastole and Systole
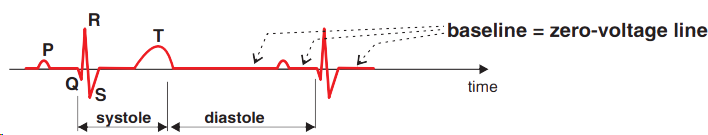
Physiological ECG Recording
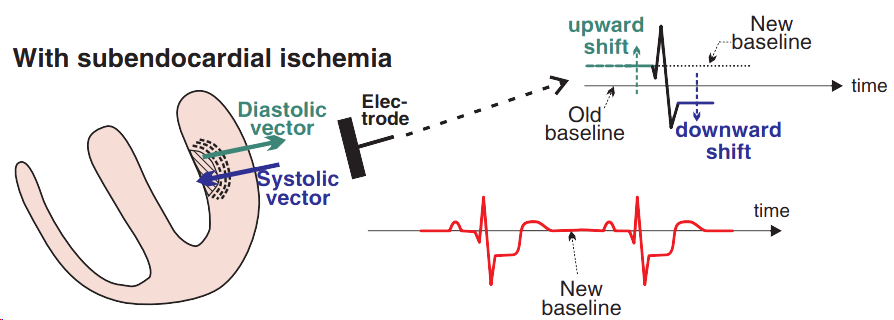
Subendocardial Ischemia


ST Depression and Ischemia
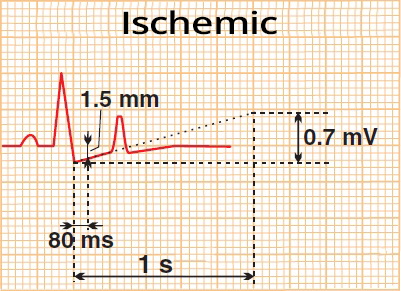
Flat Ascending ST Depression
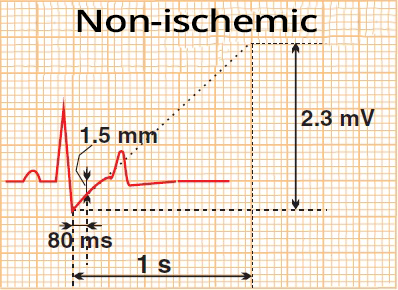
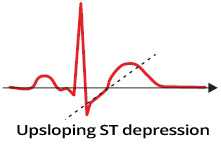
Steep Ascending ST Depression
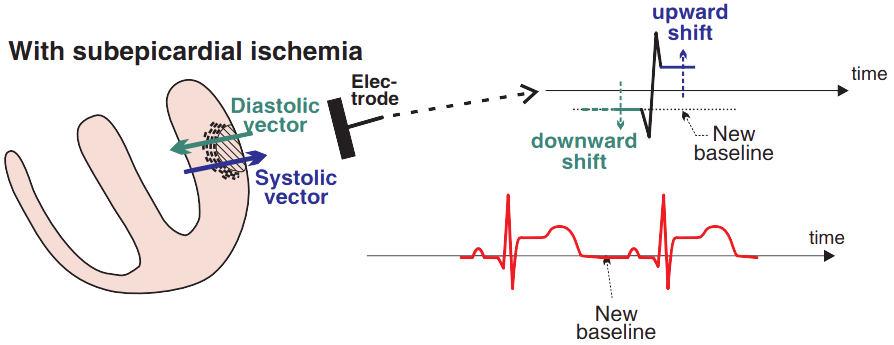
Subepicardial Ischemia
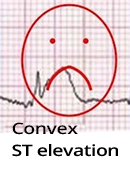
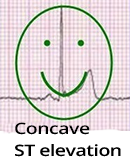

ST Elevations (STE) in Ischemia
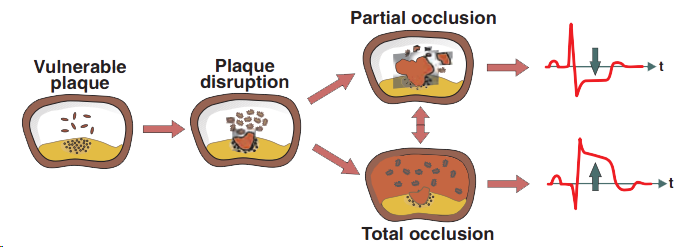
ST Segment and Acute Coronary Syndrome
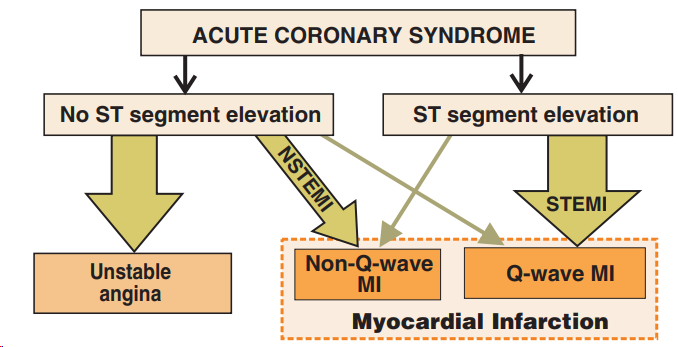
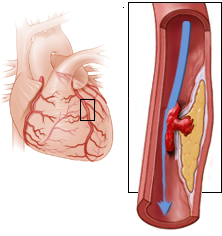

Unstable Angina Pectoris
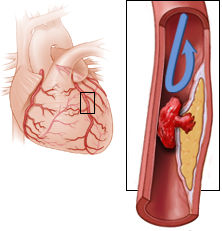
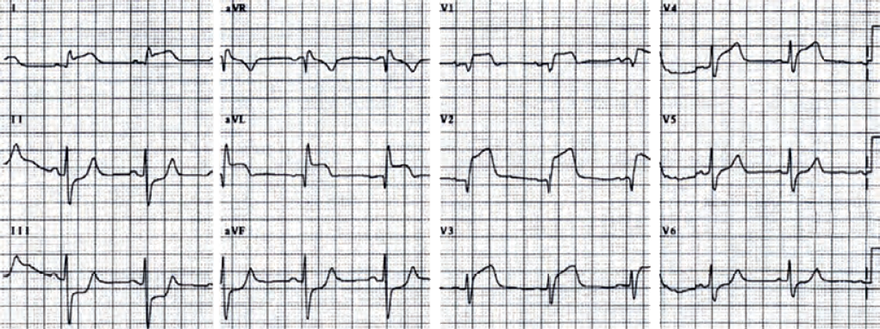
Acute STEMI of the Anterior Wall
Sources
Ischemia During Diastole and Systole
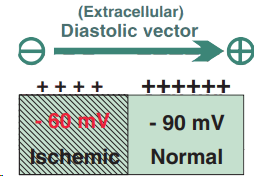
Ischemic Diastolic Vector
|
|
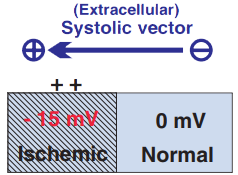
Ischemic Systolic Vector
|
|
Physiological ECG Recording
Subendocardial Ischemia
|
|
|
|
ST Depression and Ischemia
|
Flat Ascending ST Depression
|
Steep Ascending ST Depression
|
Subepicardial Ischemia
|
|
ST Elevations (STE) in Ischemia
ST Segment and Acute Coronary Syndrome
|
Unstable Angina Pectoris
|
|
|
Acute STEMI of the Anterior Wall
|
|
Sources