Home /
Ventricular Tachycardia (VT) - ECG
Ventricular tachycardia (VT)
Ventricular Rhythm

- Electrical impulses originate in the ventricles
- Each impulse then activates the ventricles through the myocardium
- Impulses spread slowly through the myocardium
- Therefore, the QRS complexes will be wide (>0.12s)
- Ventricular rhythm is very rare, it activates
- In case of SA node and AV junction malfunction
- Ventricular rhythm has a frequency of 20-40/min.
- Sometimes referred to as
- Idioventricular rhythm
- Ventricular escape rhythm
Ventricular Tachycardia
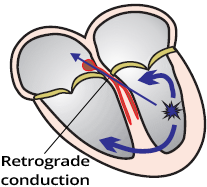
- Ventricular Tachycardia (VT) is a ventricular rhythm with a frequency > 100/min.
- Impulses are generated in the ventricles beneath the His bundle
- It is a wide-complex tachycardia (QRS width > 0.12s)
- The most common cause is
- 50% of VT cases have preserved retrograde conduction

Ventricular Tachycardia
Mechanism of Ventricular Tachycardia Formation

- An ectopic focus activates in the ventricle
- which starts generating impulses with a frequency > 100/min.
- The focus takes over the role of the pacemaker (overdrive suppression)
- The focus can generate impulses through 3 mechanisms:
- Re-entry
- Increased automaticity
- Trigger activity
- The most common mechanism is re-entry
Causes of Ventricular Tachycardia
- 90% of VT occurs in structurally damaged hearts (Re-entry easily develops in damaged myocardium):
- Channelopathies (Disruption of ion channels in the heart alters action potential):
- Inflammatory heart diseases
- Amyloidosis, sarcoidosis, rheumatoid arthritis...
- Idiopathic ventricular tachycardia
- It is ventricular tachycardia of unknown cause - it is very rare
Duration of Ventricular Tachycardia
- Ventricular tachycardia is classified based on duration into:
- Non-sustained VT (Non-sustained VT)
- Sustained VT (Sustained VT)

Non-sustained Ventricular Tachycardia
- Consists of at least 3 ventricular QRS complexes in a row
- Ends spontaneously within 30 seconds
- Non-sustained VT "does not persist" and terminates on its own within 30s

Sustained Ventricular Tachycardia
Hemodynamics of Ventricular Tachycardia
- Hemodynamically Stable VT
- Typically, it is a VT with a heart rate of < 160/min.
- The heart, despite the VT, still functions as a pump
- The patient has minimal subjective and objective symptoms
- Very rarely, the patient may be asymptomatic despite the VT
- It is not precisely defined what the patient’s blood pressure, pulse, and respiratory rate should be...
- A patient with VT can be asymptomatic for several hours (or even several days - very rarely)
- Hemodynamically Unstable VT
- Typically, it is a VT with a heart rate of > 160/min.
- Generally, VT is mostly hemodynamically unstable
- The heart is hemodynamically failing, not functioning as a pump
- The patient has severe subjective and objective symptoms
- Hypotension, shock, pulmonary edema, chest pain, palpitations, dyspnea, and even syncope
- The patient appears very ill at first glance
- It is not precisely defined what the patient’s blood pressure, pulse, and respiratory rate should be...
- This is a life-threatening condition that requires urgent treatment (e.g., electrical cardioversion)
Morphology of Ventricular Tachycardia
- Every ventricular tachycardia (VT) has
- Frequency > 100/min.
- Wide QRS complexes (> 0.12s)
- Very rarely, QRS complexes can be narrow (VT from the ventricular septum, Fascicular VT)
- Active ectopic ventricular focus (foci)
- There is no uniform classification of VT because there are many criteria:
- Structural heart damage, number and location of foci, mechanism of VT, response of VT to treatment, hemodynamic stability, shape of the ECG curve...
- The shape of the VT ECG curve depends mainly on:
- Location of the ectopic focus
- Septal, Apical, Basal, in the Outflow Tract, in the Left Ventricle, in the Right Ventricle
- Mechanism of VT
- Re-entry, Increased automaticity, Trigger activity
- Based on the morphology of the ECG curve, ventricular tachycardia is classified into:
Wide-Complex Tachycardia
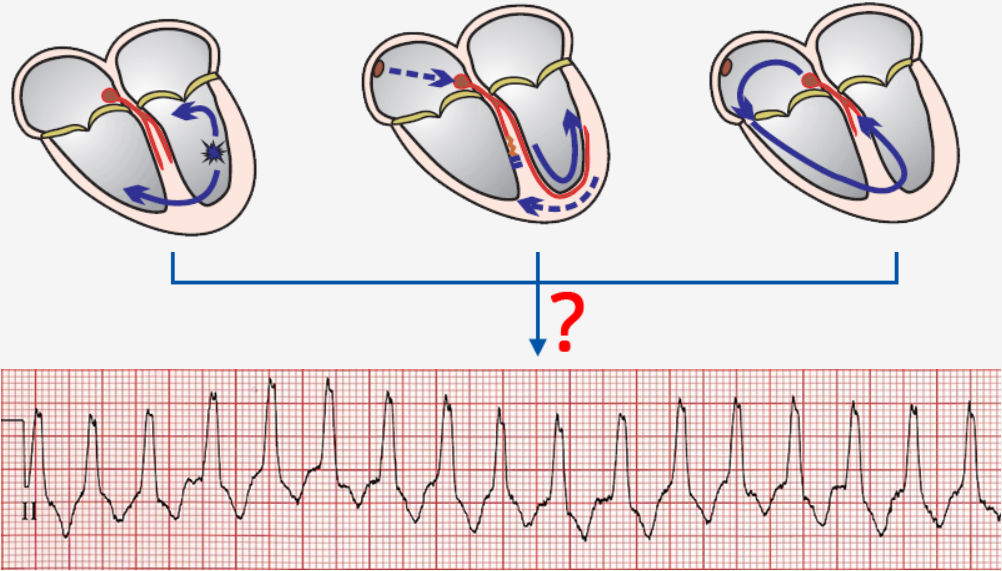
Wide-Complex Tachycardia
ECG and Ventricular Tachycardia

- Frequency > 100/min.
- Wide QRS complexes (≥ 0.12s, most often > 0.16s)
- Very rarely, QRS complexes are narrow (VT from the ventricular septum, Fascicular VT)
- Absence of typical ECG pattern of bundle branch block in leads V1, V6 (LBBB, RBBB)
- RSr configuration in V1 (Left bunny ear is larger)
- Extreme right axis deviation "north-west"
- QRS is positive in aVR
- QRS is negative in I, aVF
- AV dissociation
- Capture beats
- Fusion beats
- Precordial concordance (Positive or negative)
- Brugada sign
- Josephson sign
- R wave duration in lead II ≥ 50ms
- Each ECG finding can be logically derived
- VT does not always present all ECG findings
- Each finding has a certain sensitivity and specificity in diagnosing VT
- Diagnostic algorithms are used for diagnosing VT
Wide QRS > 0.12s (Most commonly > 0.16s)
- In sinus rhythm, the impulse spreads to the ventricles rapidly through the conduction system and activates the ventricles within 0.12s
- Therefore, the QRS complexes are narrow <0.12s
- In VT, the ventricles are activated from an ectopic focus in the ventricle
- The impulse activates the ventricles through the myocardium (not through the bundle branches)
- The impulse spreads more slowly through the myocardium, so the QRS complexes are wide > 0.12s (most commonly > 0.16s)
- The closer the focus is to the ventricular septum, the narrower the QRS complexes
- The more lateral the focus, the wider the QRS complexes
- In general, wider QRS complexes are caused by delayed conduction through the ventricles:
- Ventricular tachycardia with narrow QRS complexes (Exceptionally, VT can have QRS complexes that are not wide ≤0.12s)

Monomorphic Ventricular Tachycardia
Absence of Typical Tawar Bundle Branch Block EKG Pattern (V1, V6)
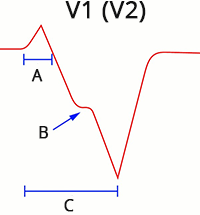
- A: r wave > 0.03s
- B: Josephson sign
- C: Brugada sign
- In the case of bundle branch block (left or right):
- The ventricles first activate through the non-blocked bundle branch
- Then, the other ventricle activates with delay through the myocardium, making the QRS complex wide (>0.12s)
- If the VT focus is lateral in the ventricle, both ventricles are activated through the myocardium from the focus
- The QRS will resemble bundle branch block and does not meet the EKG criteria for bundle branch block
- VT with Right Bundle Branch Block Pattern (Right Bundle Branch Block)
- In V1, the QRS complex is bifasic (R, qR, QR, RS)
- If V1 shows a trifasic QRS (Rsr), then the left rabbit ear is larger
- In V6, the R/S ratio is < 1
- Extreme right axis deviation (180° to -90°)
- VT with Left Bundle Branch Block Pattern (Left Bundle Branch Block)
- In V1, the initial r wave is wider than 0.03s
- In V1, there is a notch on the descending part of the S wave (Slurring or notching of S wave)
- In V1, the RS interval is > 0.1s
- In V6, there is a q (Q) wave
- Right axis deviation (90° to 180°)
- Negative QRS in I
- Positive QRS in aVF

Right Bundle Branch Block
- Wide QRS > 0.12s
- "M" rsR' configuration (V1) - The right rabbit ear is larger
- "W" configuration (V6) - Deep S wave

Ventricular Tachycardia with RBBB Pattern
- Heart rate: 150/min
- Wide QRS > 0.12s
- In V1, there is a wide, high R wave
- Does not have the typical RBBB configuration (in RBBB, the right rabbit ear is larger - rsR')
- Leads V1 and V6 do not resemble RBBB
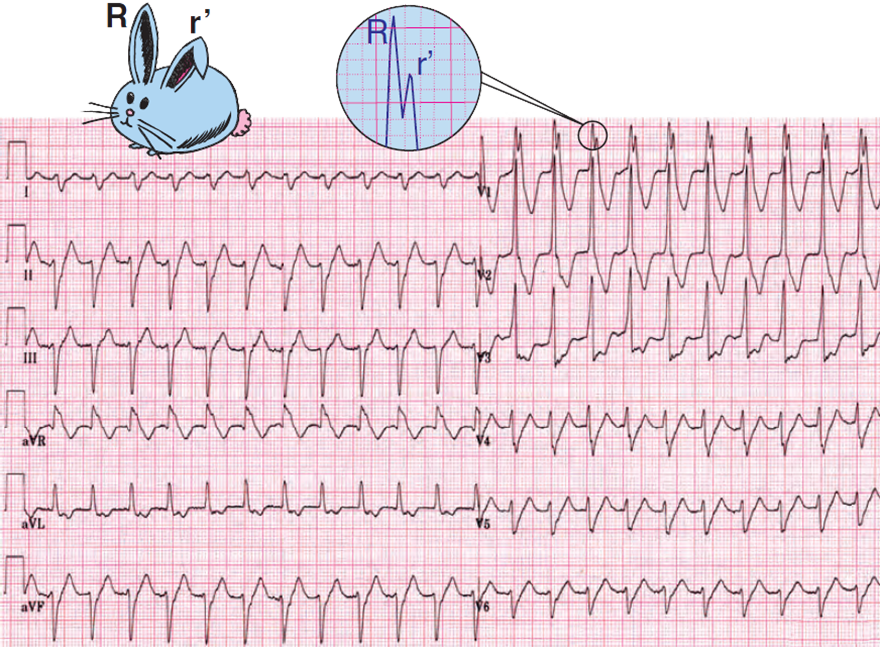
Ventricular Tachycardia with RBBB Pattern
- Heart Rate: 135/min.
- Wide QRS > 0.12s
- Extreme right axis deviation (180° to -90°)
- In V1 RsR (left rabbit ear is larger)
- Left rabbit ear is typical for ventricular tachycardia

Ventricular Tachycardia with RBBB Pattern
- Heart Rate 143/min
- Wide QRS > 0.12s
- QRS are borderline widened approximately 0.13s
- In V1 rsR (right rabbit ear is larger)
- This is the RBBB pattern (but it is ventricular tachycardia)
- Extreme right axis deviation (180° to -90°)
- Negative QRS (I, aVF)
Supraventricular tachycardia with RBBB does not have such an extremely deviated axis
- This is a rare fascicular ventricular tachycardia with the focus in the left posterior fascicle

Left Bundle Branch Block
- Wide QRS > 0.12s
- "W" configuration (V1) - Deep S wave
- "M" configuration (V6) - Dominant R wave

Ventricular Tachycardia with LBBB Morphology
- Heart rate 150/min
- Wide QRS > 0.12s
- Brugada sign (V1)
- V1 RS interval > 100ms (From the beginning of the QRS complex to the peak of the S wave is > 100ms)
- Right axis deviation (90° to 180°)
- Negative QRS (I)
- Positive QRS (aVF)
- VA association

Ventricular Tachycardia with LBBB Morphology
- Heart rate: 143/min
- Wide QRS > 0.18s
- In V1 the r wave > 0.03s (0.05s)
- Extreme left axis deviation (-30° to -90°)
- Negative QRS (II, III)
- Positive QRS (aVL)
Left Rabbit Ear (V1)
- In right bundle branch block, the V1 rsR configuration appears
- The right rabbit ear is larger
- If ventricular tachycardia produces a positive Rsr in V1 (ectopic focus is in the left ventricle)
- Then there is a larger left rabbit ear

Right Bundle Branch Block
- Wide QRS > 0.12s
- "M" rsR configuration (V1) - The right rabbit ear is larger
- "W" configuration (V6) - Deep S wave

Ventricular Tachycardia with a BPTR Pattern
- Wide QRS > 0.12s
- "M" Rsr configuration (V1)

Ventricular Tachycardia with BPTR Pattern
- Wide monophasic QRS (V1) > 0.12s
- Left bunny ear is larger (blue arrow - It is not a typical "bunny ear")
Extreme Right Axis Deviation "Northwest"
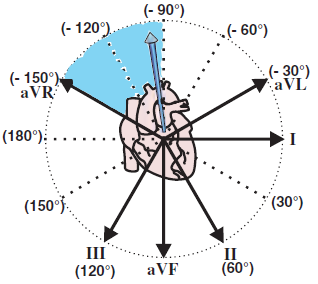

Ventricular Tachycardia
- Frequency: 150/min
- Wide QRS > 0.12s
- Wide high R wave in V1
- Does not have the typical configuration for BPTR
- Extreme right axis deviation "Northwest"
- Negative QRS (I, aVF)
- Positive QRS (aVR)
AV Dissociation and VA Association
- 50% of VT cases have preserved retrograde conduction (This is VA association)
- Ventricular impulses activate the ventricles and then retrogradely spread through the AV node to the atria
- The atria are activated retrogradely (bottom to top)
- VA association (Ventriculoatrial association) means there is an "association" between the ventricles and the atria
- The impulse first activates the ventricles and then retrogradely activates the atria
- Retrograde conduction gradually disappears with increasing VT frequency
- 50% of VT cases have AV dissociation
- Impulses originate in the ventricle and simultaneously in the SA node
- Ventricular impulses have a higher frequency (> 100/min.)
- Impulses from the SA node create a P wave, but are then blocked in the AV junction
- Because in the AV junction two impulses meet in the refractory period (one from the ventricles and the other from the SA node)
- AV dissociation is seen on EKG as the independence of P waves from QRS complexes
- Note that AV dissociation is not AV block III degree, but AV block III degree will show AV dissociation on EKG
- P waves are often not seen during VT because they are embedded within wide QRS complexes
- Therefore, AV dissociation is not visible
- To better visualize AV dissociation during ventricular tachycardia, a Lewis lead may be used

Ventricular Tachycardia
- AV Dissociation
- QRS complexes and P waves are independent
- P waves have a frequency of 100/min. (some P waves are hidden within the QRS complex)
- QRS complexes have a frequency of 150/min.
- If the P wave were to conduct to the ventricles, a narrow QRS complex would occur

Ventricular Tachycardia
- The first QRS complex is a sinus beat
- Then follows ventricular tachycardia (wide QRS complexes >0.12s)
- The SA node still generates impulses (P waves) with a frequency of 60/min.
- An ectopic ventricular focus generates impulses (QRS) with a frequency of 150/min.
- Ventricular impulses do not pass to the atria, and atrial impulses do not pass to the ventricles
- On the EKG, we see AV dissociation (independence of P waves from QRS complexes)


Ventricular Tachycardia
- All QRS complexes are identical, none are deformed by P waves
- This is VA association (Ventriculoatrial association)
- Retrograde conduction is preserved
- Impulses from the ventricles pass to the atria and reset the SA node, which does not generate impulses (P waves)

Ventricular Tachycardia
- Wide QRS complexes 0.18s
- Frequency: 130/min.
- AV Dissociation
- P waves are independent of QRS complexes
- P waves deform QRS complexes and T waves
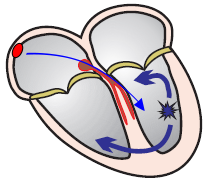
Capture Beat
- During the course of ventricular tachycardia (in the presence of AV dissociation or VA association)
- The SA node may rarely generate an impulse in time
- Which the AV node conducts to the ventricles, and resets the ectopic focus in the ventricle (overdrive suppression)
- The ventricles are thus activated by a supraventricular impulse during the course of ventricular tachycardia
- On the EKG, we see a narrow sinus beat during ventricular tachycardia
- This beat is exactly the same as seen on EKG during sinus rhythm
- This is a capture beat because the impulse from the SA node "captures" the conduction system and the ventricles
- In the excitable phase (outside the refractory period) during ventricular tachycardia

Ventricular Tachycardia
- Capture Beat
- During ventricular tachycardia, we see a P wave and a narrow sinus QRS complex
- During VT, the impulse from the SA node (P wave) conducts to the ventricles and activates them (QRS)
Fusion Beat
- During VT, an impulse originates in the SA node and conducts to the ventricles at a time
- when two impulses meet in the ventricles (atrial + ventricular)
- A Fusion Beat occurs
- The result is a deformed QRS complex, which is
- Smaller than the ectopic ventricular QRS complex
- Larger than the sinus QRS complex (Capture Beat)
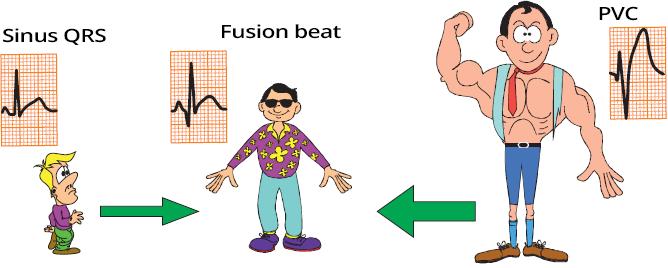
Capture Beat, Fusion Beat, Ventricular Beat
- Sinus Beat (Capture Beat)
- Ventricular Beat
- The ventricles are activated by an impulse from an ectopic ventricular focus through the myocardium, not through the conduction system, resulting in a wide QRS complex
- It is essentially a ventricular extrasystole (VES); 3 VES in a row is considered VT
- Fusion Beat
- The ventricular myocardium is activated by 2 impulses
- One from the atrium (SA node)
- The other from the ventricular ectopic focus
- The ectopic focus and the SA node generated impulses simultaneously, and did not reset in the AV junction
- A deformed QRS is produced (different from both sinus and ventricular)
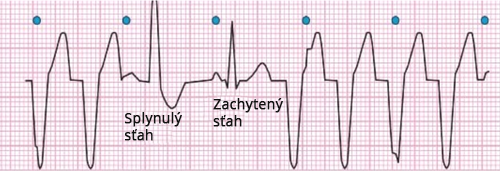
Ventricular Tachycardia
- AV Dissociation
- QRS complexes and P waves are independent of each other
- Fusion Beat
- An impulse from the SA node (P wave) occurred at a time when it was conducted to the ventricles
- However, in the ventricles, 2 impulses met:
- One from the SA node
- The other from a ventricular ectopic focus
- The ventricles are activated by 2 impulses
- Capture Beat
- An impulse from the SA node (P wave) occurred at a time when it was conducted to the ventricles and reset the ventricular ectopic focus
- Thus, the ventricles are activated solely by the impulse from the SA node
- Then ventricular tachycardia resumes
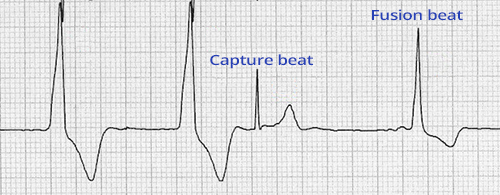
Capture Beat and Fusion Beat
- Ventricular Extrasystoles (Couplet) (1st and 2nd wide QRS complexes)
- Capture Beat
- The SA node outpaced and deactivated the ventricular focus
- Fusion Beat
- Two impulses met in the ventricles:
- One from the SA node
- The other from a ventricular ectopic focus
Precordial Concordance (Positive or Negative)
- Concordance means "agreement" or "consensus"
- Negative or positive precordial concordance means
- that all precordial QRS complexes (V1-V6) are either positive or negative
- Negative Concordance - all precordial (V1-V6) QRS are negative
- An ectopic focus of VT is located in the apical region of the heart
- Negative concordance is highly specific for VT
- Positive Concordance - all precordial (V1-V6) QRS are positive
- The ectopic focus is located in the posterior wall or base of the heart
- The main ventricular vector points towards the precordial leads
- Positive concordance can also be seen in antidromic AVRT with a posterior accessory pathway
- Therefore, positive concordance is not as specific for VT as negative concordance
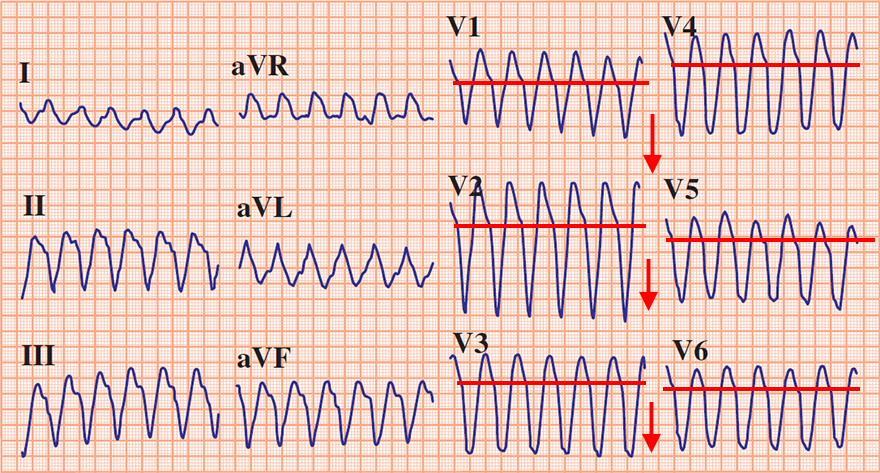
Ventricular Tachycardia
- Frequency: 160/min.
- Wide QRS complexes 0.2s
- If the QRS is wide > 0.16s, it is almost always VT
- Negative Precordial Concordance
- All QRS complexes (V1-V6) are negative
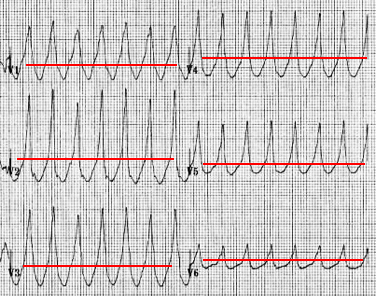
Ventricular Tachycardia
- Frequency: 160/min.
- Wide QRS complexes 0.2s
- If the QRS is wider than 0.16s, it is almost always VT
- Positive Precordial Concordance
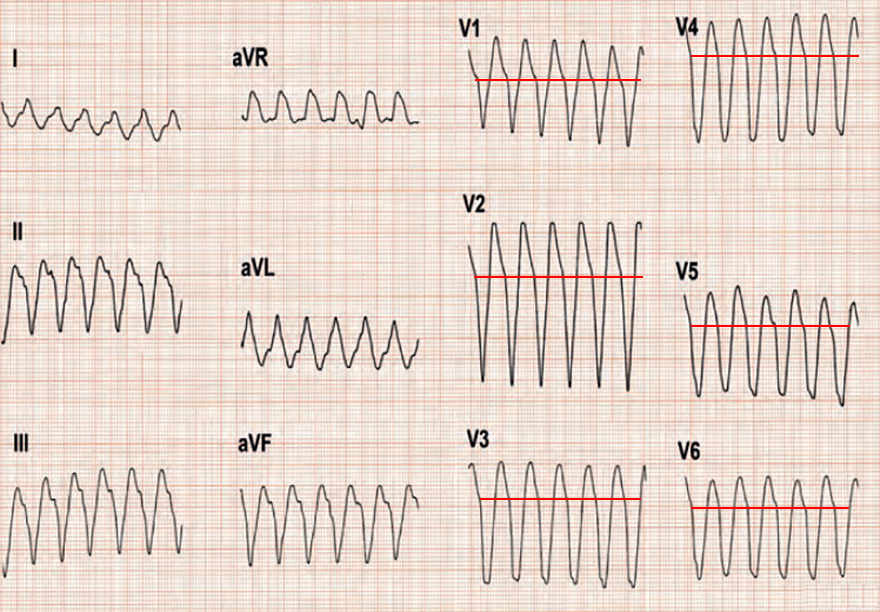
Ventricular Tachycardia
- Frequency: 160/min.
- Wide QRS complexes 0.2s
- If the QRS is wider than 0.16s, it is almost always VT
- Negative Precordial Concordance
- All QRS complexes (V1-V6) are negative
Brugada Sign

- In VT, the ventricles are activated from an ectopic focus
- Interval from the start of QRS to the peak of the S wave (RS interval)
- is the time during which the ventricles are completely depolarized (from the septum to the base)
- In VT, the RS interval > 100ms (more than 2.5 small squares) in any lead
- Because ventricular activation through the myocardium is longer than through the conduction system

Ventricular Tachycardia
Josephson Sign
- In VT, the ventricles are almost always structurally altered (due to infarction, cardiomyopathy, etc.)
- During the propagation of the impulse through the damaged myocardium, the vector may partially change direction
- which is seen as a notch on the descending part of the S wave (Notching near the nadir of the S-wave)
- The Josephson sign is evaluated in any lead

Josephson Sign and Brugada Sign
- Brugada Sign
- Josephson Sign
- Notch on the descending part of the S wave (blue arrow)
R Wave Peak Time (II) ≥ 50ms

- The R Wave Peak Time (RWPT) ≥ 0.5s
- In VT, there is a prolonged ventricular depolarization
- The principle of R Wave Peak Time is the same as with the Brugada sign
- R Wave Peak Time (II) ≥ 50ms
- Assessed only in lead II
- If there is a Q wave in lead II, then the Q Wave Peak Time is assessed
- Used for rapid diagnosis of wide-complex tachycardia
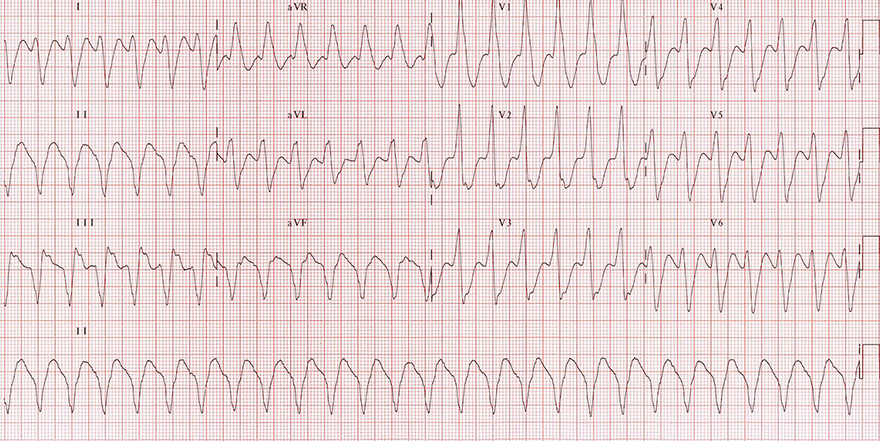
Ventricular Tachycardia
- Wide QRS complexes 0.2s
- Extreme right axis deviation (180° to -90°)
- Brugada Sign
- Josephson Sign
- Notch on the descending part of the S wave (II, III, aVF)
- R (Q) wave peak time in lead II > 50ms
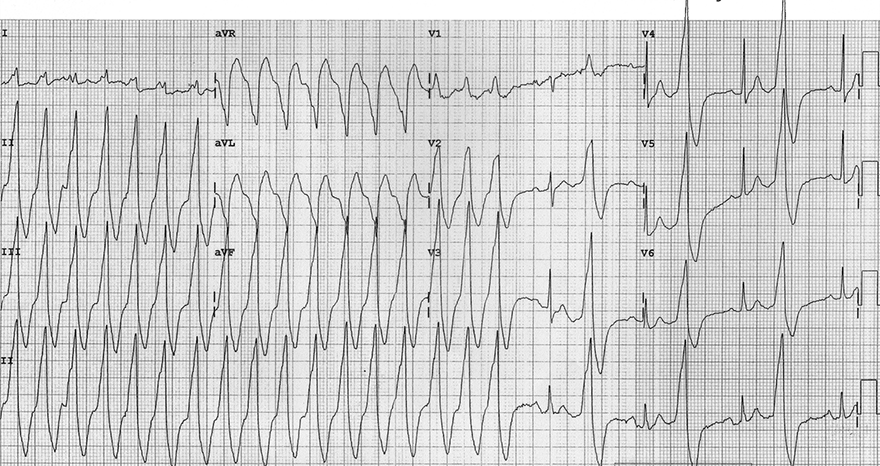
Ventricular Tachycardia
- Wide QRS complexes 0.2s
- Positive precordial concordance (V1-V6)
- Brugada Sign
- RS interval > 100ms (aVR, aVL)
- In the second half of the ECG, there is ventricular bigeminy
- R (Q) wave peak time in lead II > 50ms
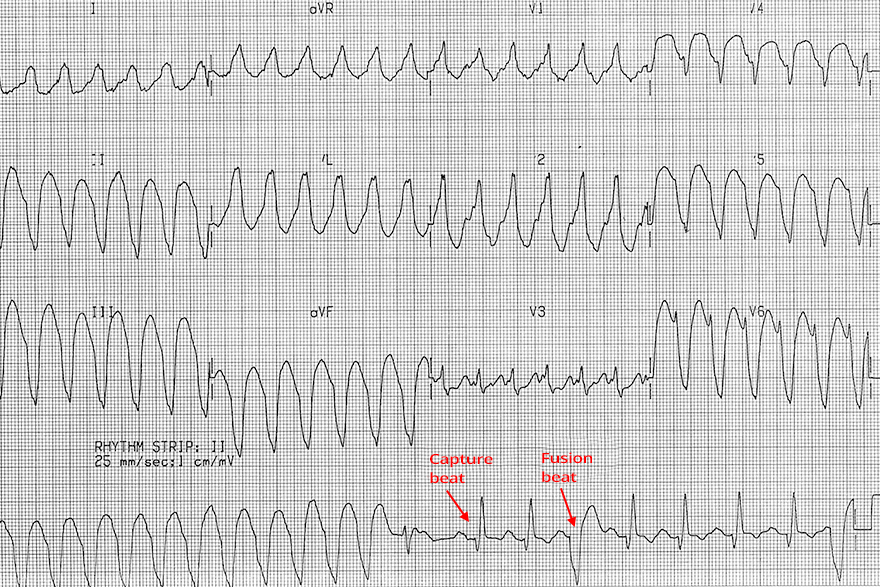
Ventricular Tachycardia
- Wide QRS Complexes: 0.2s
- In the second half of the continuous lead (rhythm strip), there are capture beats and fusion beats
- The continuous lead was recorded after the 12-lead ECG
- Therefore, the beats are not shown in the precordial and chest leads
- Brugada Sign
- R (Q) wave peak time in lead II > 50ms
Sources
- ECG from Basics to Essentials Step by Step
- litfl.com
- ecgwaves.com
- metealpaslan.com
- medmastery.com
- uptodate.com
- ecgpedia.org
- wikipedia.org
- Strong Medicine
- Understanding Pacemakers
Home /
Ventricular Tachycardia (VT) - ECG
Ventricular tachycardia (VT)
Ventricular Rhythm
- Electrical impulses originate in the ventricles
- Each impulse then activates the ventricles through the myocardium
- Impulses spread slowly through the myocardium
- Therefore, the QRS complexes will be wide (>0.12s)
- Ventricular rhythm is very rare, it activates
- In case of SA node and AV junction malfunction
- Ventricular rhythm has a frequency of 20-40/min.
- Sometimes referred to as
- Idioventricular rhythm
- Ventricular escape rhythm
|

|
Ventricular Tachycardia
- Ventricular Tachycardia (VT) is a ventricular rhythm with a frequency > 100/min.
- Impulses are generated in the ventricles beneath the His bundle
- It is a wide-complex tachycardia (QRS width > 0.12s)
- The most common cause is
- 50% of VT cases have preserved retrograde conduction
|

|

Ventricular Tachycardia
Mechanism of Ventricular Tachycardia Formation
- An ectopic focus activates in the ventricle
- which starts generating impulses with a frequency > 100/min.
- The focus takes over the role of the pacemaker (overdrive suppression)
- The focus can generate impulses through 3 mechanisms:
- Re-entry
- Increased automaticity
- Trigger activity
- The most common mechanism is re-entry
|

|
Causes of Ventricular Tachycardia
- 90% of VT occurs in structurally damaged hearts (Re-entry easily develops in damaged myocardium):
- Channelopathies (Disruption of ion channels in the heart alters action potential):
- Inflammatory heart diseases
- Amyloidosis, sarcoidosis, rheumatoid arthritis...
- Idiopathic ventricular tachycardia
- It is ventricular tachycardia of unknown cause - it is very rare
Duration of Ventricular Tachycardia
- Ventricular tachycardia is classified based on duration into:
- Non-sustained VT (Non-sustained VT)
- Sustained VT (Sustained VT)

Non-sustained Ventricular Tachycardia
- Consists of at least 3 ventricular QRS complexes in a row
- Ends spontaneously within 30 seconds
- Non-sustained VT "does not persist" and terminates on its own within 30s

Sustained Ventricular Tachycardia
Hemodynamics of Ventricular Tachycardia
- Hemodynamically Stable VT
- Typically, it is a VT with a heart rate of < 160/min.
- The heart, despite the VT, still functions as a pump
- The patient has minimal subjective and objective symptoms
- Very rarely, the patient may be asymptomatic despite the VT
- It is not precisely defined what the patient’s blood pressure, pulse, and respiratory rate should be...
- A patient with VT can be asymptomatic for several hours (or even several days - very rarely)
- Hemodynamically Unstable VT
- Typically, it is a VT with a heart rate of > 160/min.
- Generally, VT is mostly hemodynamically unstable
- The heart is hemodynamically failing, not functioning as a pump
- The patient has severe subjective and objective symptoms
- Hypotension, shock, pulmonary edema, chest pain, palpitations, dyspnea, and even syncope
- The patient appears very ill at first glance
- It is not precisely defined what the patient’s blood pressure, pulse, and respiratory rate should be...
- This is a life-threatening condition that requires urgent treatment (e.g., electrical cardioversion)
Morphology of Ventricular Tachycardia
- Every ventricular tachycardia (VT) has
- Frequency > 100/min.
- Wide QRS complexes (> 0.12s)
- Very rarely, QRS complexes can be narrow (VT from the ventricular septum, Fascicular VT)
- Active ectopic ventricular focus (foci)
- There is no uniform classification of VT because there are many criteria:
- Structural heart damage, number and location of foci, mechanism of VT, response of VT to treatment, hemodynamic stability, shape of the ECG curve...
- The shape of the VT ECG curve depends mainly on:
- Location of the ectopic focus
- Septal, Apical, Basal, in the Outflow Tract, in the Left Ventricle, in the Right Ventricle
- Mechanism of VT
- Re-entry, Increased automaticity, Trigger activity
- Based on the morphology of the ECG curve, ventricular tachycardia is classified into:
Wide-Complex Tachycardia


Wide-Complex Tachycardia
ECG and Ventricular Tachycardia
- Frequency > 100/min.
- Wide QRS complexes (≥ 0.12s, most often > 0.16s)
- Very rarely, QRS complexes are narrow (VT from the ventricular septum, Fascicular VT)
- Absence of typical ECG pattern of bundle branch block in leads V1, V6 (LBBB, RBBB)
- RSr configuration in V1 (Left bunny ear is larger)
- Extreme right axis deviation "north-west"
- QRS is positive in aVR
- QRS is negative in I, aVF
- AV dissociation
- Capture beats
- Fusion beats
- Precordial concordance (Positive or negative)
- Brugada sign
- Josephson sign
- R wave duration in lead II ≥ 50ms
- Each ECG finding can be logically derived
- VT does not always present all ECG findings
- Each finding has a certain sensitivity and specificity in diagnosing VT
- Diagnostic algorithms are used for diagnosing VT
|

|
Wide QRS > 0.12s (Most commonly > 0.16s)
Absence of Typical Tawar Bundle Branch Block EKG Pattern (V1, V6)
- In the case of bundle branch block (left or right):
- The ventricles first activate through the non-blocked bundle branch
- Then, the other ventricle activates with delay through the myocardium, making the QRS complex wide (>0.12s)
- If the VT focus is lateral in the ventricle, both ventricles are activated through the myocardium from the focus
- The QRS will resemble bundle branch block and does not meet the EKG criteria for bundle branch block
- VT with Right Bundle Branch Block Pattern (Right Bundle Branch Block)
- In V1, the QRS complex is bifasic (R, qR, QR, RS)
- If V1 shows a trifasic QRS (Rsr), then the left rabbit ear is larger
- In V6, the R/S ratio is < 1
- Extreme right axis deviation (180° to -90°)
- VT with Left Bundle Branch Block Pattern (Left Bundle Branch Block)
- In V1, the initial r wave is wider than 0.03s
- In V1, there is a notch on the descending part of the S wave (Slurring or notching of S wave)
- In V1, the RS interval is > 0.1s
- In V6, there is a q (Q) wave
- Right axis deviation (90° to 180°)
- Negative QRS in I
- Positive QRS in aVF
|

- A: r wave > 0.03s
- B: Josephson sign
- C: Brugada sign
|

Right Bundle Branch Block
- Wide QRS > 0.12s
- "M" rsR' configuration (V1) - The right rabbit ear is larger
- "W" configuration (V6) - Deep S wave

Ventricular Tachycardia with RBBB Pattern
- Heart rate: 150/min
- Wide QRS > 0.12s
- In V1, there is a wide, high R wave
- Does not have the typical RBBB configuration (in RBBB, the right rabbit ear is larger - rsR')
- Leads V1 and V6 do not resemble RBBB

Ventricular Tachycardia with RBBB Pattern
- Heart Rate: 135/min.
- Wide QRS > 0.12s
- Extreme right axis deviation (180° to -90°)
- In V1 RsR (left rabbit ear is larger)
- Left rabbit ear is typical for ventricular tachycardia

Ventricular Tachycardia with RBBB Pattern
- Heart Rate 143/min
- Wide QRS > 0.12s
- QRS are borderline widened approximately 0.13s
- In V1 rsR (right rabbit ear is larger)
- This is the RBBB pattern (but it is ventricular tachycardia)
- Extreme right axis deviation (180° to -90°)
- Negative QRS (I, aVF)
Supraventricular tachycardia with RBBB does not have such an extremely deviated axis
- This is a rare fascicular ventricular tachycardia with the focus in the left posterior fascicle

Left Bundle Branch Block
- Wide QRS > 0.12s
- "W" configuration (V1) - Deep S wave
- "M" configuration (V6) - Dominant R wave

Ventricular Tachycardia with LBBB Morphology
- Heart rate 150/min
- Wide QRS > 0.12s
- Brugada sign (V1)
- V1 RS interval > 100ms (From the beginning of the QRS complex to the peak of the S wave is > 100ms)
- Right axis deviation (90° to 180°)
- Negative QRS (I)
- Positive QRS (aVF)
- VA association

Ventricular Tachycardia with LBBB Morphology
- Heart rate: 143/min
- Wide QRS > 0.18s
- In V1 the r wave > 0.03s (0.05s)
- Extreme left axis deviation (-30° to -90°)
- Negative QRS (II, III)
- Positive QRS (aVL)
Left Rabbit Ear (V1)
- In right bundle branch block, the V1 rsR configuration appears
- The right rabbit ear is larger
- If ventricular tachycardia produces a positive Rsr in V1 (ectopic focus is in the left ventricle)
- Then there is a larger left rabbit ear

Right Bundle Branch Block
- Wide QRS > 0.12s
- "M" rsR configuration (V1) - The right rabbit ear is larger
- "W" configuration (V6) - Deep S wave

Ventricular Tachycardia with a BPTR Pattern
- Wide QRS > 0.12s
- "M" Rsr configuration (V1)

Ventricular Tachycardia with BPTR Pattern
- Wide monophasic QRS (V1) > 0.12s
- Left bunny ear is larger (blue arrow - It is not a typical "bunny ear")
Extreme Right Axis Deviation "Northwest"

|
Ventricular Tachycardia
- Frequency: 150/min
- Wide QRS > 0.12s
- Wide high R wave in V1
- Does not have the typical configuration for BPTR
- Extreme right axis deviation "Northwest"
- Negative QRS (I, aVF)
- Positive QRS (aVR)
|

|
AV Dissociation and VA Association
- 50% of VT cases have preserved retrograde conduction (This is VA association)
- Ventricular impulses activate the ventricles and then retrogradely spread through the AV node to the atria
- The atria are activated retrogradely (bottom to top)
- VA association (Ventriculoatrial association) means there is an "association" between the ventricles and the atria
- The impulse first activates the ventricles and then retrogradely activates the atria
- Retrograde conduction gradually disappears with increasing VT frequency
- 50% of VT cases have AV dissociation
- Impulses originate in the ventricle and simultaneously in the SA node
- Ventricular impulses have a higher frequency (> 100/min.)
- Impulses from the SA node create a P wave, but are then blocked in the AV junction
- Because in the AV junction two impulses meet in the refractory period (one from the ventricles and the other from the SA node)
- AV dissociation is seen on EKG as the independence of P waves from QRS complexes
- Note that AV dissociation is not AV block III degree, but AV block III degree will show AV dissociation on EKG
- P waves are often not seen during VT because they are embedded within wide QRS complexes
- Therefore, AV dissociation is not visible
- To better visualize AV dissociation during ventricular tachycardia, a Lewis lead may be used

Ventricular Tachycardia
- AV Dissociation
- QRS complexes and P waves are independent
- P waves have a frequency of 100/min. (some P waves are hidden within the QRS complex)
- QRS complexes have a frequency of 150/min.
- If the P wave were to conduct to the ventricles, a narrow QRS complex would occur

Ventricular Tachycardia
- The first QRS complex is a sinus beat
- Then follows ventricular tachycardia (wide QRS complexes >0.12s)
- The SA node still generates impulses (P waves) with a frequency of 60/min.
- An ectopic ventricular focus generates impulses (QRS) with a frequency of 150/min.
- Ventricular impulses do not pass to the atria, and atrial impulses do not pass to the ventricles
- On the EKG, we see AV dissociation (independence of P waves from QRS complexes)
Ventricular Tachycardia
- All QRS complexes are identical, none are deformed by P waves
- This is VA association (Ventriculoatrial association)
- Retrograde conduction is preserved
- Impulses from the ventricles pass to the atria and reset the SA node, which does not generate impulses (P waves)

Ventricular Tachycardia
- Wide QRS complexes 0.18s
- Frequency: 130/min.
- AV Dissociation
- P waves are independent of QRS complexes
- P waves deform QRS complexes and T waves
Capture Beat
- During the course of ventricular tachycardia (in the presence of AV dissociation or VA association)
- The SA node may rarely generate an impulse in time
- Which the AV node conducts to the ventricles, and resets the ectopic focus in the ventricle (overdrive suppression)
- The ventricles are thus activated by a supraventricular impulse during the course of ventricular tachycardia
- On the EKG, we see a narrow sinus beat during ventricular tachycardia
- This beat is exactly the same as seen on EKG during sinus rhythm
- This is a capture beat because the impulse from the SA node "captures" the conduction system and the ventricles
- In the excitable phase (outside the refractory period) during ventricular tachycardia
Ventricular Tachycardia
- Capture Beat
- During ventricular tachycardia, we see a P wave and a narrow sinus QRS complex
- During VT, the impulse from the SA node (P wave) conducts to the ventricles and activates them (QRS)
Fusion Beat
- During VT, an impulse originates in the SA node and conducts to the ventricles at a time
- when two impulses meet in the ventricles (atrial + ventricular)
- A Fusion Beat occurs
- The result is a deformed QRS complex, which is
- Smaller than the ectopic ventricular QRS complex
- Larger than the sinus QRS complex (Capture Beat)

Capture Beat, Fusion Beat, Ventricular Beat
- Sinus Beat (Capture Beat)
- Ventricular Beat
- The ventricles are activated by an impulse from an ectopic ventricular focus through the myocardium, not through the conduction system, resulting in a wide QRS complex
- It is essentially a ventricular extrasystole (VES); 3 VES in a row is considered VT
- Fusion Beat
- The ventricular myocardium is activated by 2 impulses
- One from the atrium (SA node)
- The other from the ventricular ectopic focus
- The ectopic focus and the SA node generated impulses simultaneously, and did not reset in the AV junction
- A deformed QRS is produced (different from both sinus and ventricular)

Ventricular Tachycardia
- AV Dissociation
- QRS complexes and P waves are independent of each other
- Fusion Beat
- An impulse from the SA node (P wave) occurred at a time when it was conducted to the ventricles
- However, in the ventricles, 2 impulses met:
- One from the SA node
- The other from a ventricular ectopic focus
- The ventricles are activated by 2 impulses
- Capture Beat
- An impulse from the SA node (P wave) occurred at a time when it was conducted to the ventricles and reset the ventricular ectopic focus
- Thus, the ventricles are activated solely by the impulse from the SA node
- Then ventricular tachycardia resumes

Capture Beat and Fusion Beat
- Ventricular Extrasystoles (Couplet) (1st and 2nd wide QRS complexes)
- Capture Beat
- The SA node outpaced and deactivated the ventricular focus
- Fusion Beat
- Two impulses met in the ventricles:
- One from the SA node
- The other from a ventricular ectopic focus
Precordial Concordance (Positive or Negative)
- Concordance means "agreement" or "consensus"
- Negative or positive precordial concordance means
- that all precordial QRS complexes (V1-V6) are either positive or negative
- Negative Concordance - all precordial (V1-V6) QRS are negative
- An ectopic focus of VT is located in the apical region of the heart
- Negative concordance is highly specific for VT
- Positive Concordance - all precordial (V1-V6) QRS are positive
- The ectopic focus is located in the posterior wall or base of the heart
- The main ventricular vector points towards the precordial leads
- Positive concordance can also be seen in antidromic AVRT with a posterior accessory pathway
- Therefore, positive concordance is not as specific for VT as negative concordance

Ventricular Tachycardia
- Frequency: 160/min.
- Wide QRS complexes 0.2s
- If the QRS is wide > 0.16s, it is almost always VT
- Negative Precordial Concordance
- All QRS complexes (V1-V6) are negative

Ventricular Tachycardia
- Frequency: 160/min.
- Wide QRS complexes 0.2s
- If the QRS is wider than 0.16s, it is almost always VT
- Positive Precordial Concordance

Ventricular Tachycardia
- Frequency: 160/min.
- Wide QRS complexes 0.2s
- If the QRS is wider than 0.16s, it is almost always VT
- Negative Precordial Concordance
- All QRS complexes (V1-V6) are negative
Brugada Sign
- In VT, the ventricles are activated from an ectopic focus
- Interval from the start of QRS to the peak of the S wave (RS interval)
- is the time during which the ventricles are completely depolarized (from the septum to the base)
- In VT, the RS interval > 100ms (more than 2.5 small squares) in any lead
- Because ventricular activation through the myocardium is longer than through the conduction system

Ventricular Tachycardia
|

|
Josephson Sign
- In VT, the ventricles are almost always structurally altered (due to infarction, cardiomyopathy, etc.)
- During the propagation of the impulse through the damaged myocardium, the vector may partially change direction
- which is seen as a notch on the descending part of the S wave (Notching near the nadir of the S-wave)
- The Josephson sign is evaluated in any lead

Josephson Sign and Brugada Sign
- Brugada Sign
- Josephson Sign
- Notch on the descending part of the S wave (blue arrow)
R Wave Peak Time (II) ≥ 50ms
- The R Wave Peak Time (RWPT) ≥ 0.5s
- In VT, there is a prolonged ventricular depolarization
- The principle of R Wave Peak Time is the same as with the Brugada sign
- R Wave Peak Time (II) ≥ 50ms
- Assessed only in lead II
- If there is a Q wave in lead II, then the Q Wave Peak Time is assessed
- Used for rapid diagnosis of wide-complex tachycardia
|

|

Ventricular Tachycardia
- Wide QRS complexes 0.2s
- Extreme right axis deviation (180° to -90°)
- Brugada Sign
- Josephson Sign
- Notch on the descending part of the S wave (II, III, aVF)
- R (Q) wave peak time in lead II > 50ms

Ventricular Tachycardia
- Wide QRS complexes 0.2s
- Positive precordial concordance (V1-V6)
- Brugada Sign
- RS interval > 100ms (aVR, aVL)
- In the second half of the ECG, there is ventricular bigeminy
- R (Q) wave peak time in lead II > 50ms

Ventricular Tachycardia
- Wide QRS Complexes: 0.2s
- In the second half of the continuous lead (rhythm strip), there are capture beats and fusion beats
- The continuous lead was recorded after the 12-lead ECG
- Therefore, the beats are not shown in the precordial and chest leads
- Brugada Sign
- R (Q) wave peak time in lead II > 50ms
Sources
- ECG from Basics to Essentials Step by Step
- litfl.com
- ecgwaves.com
- metealpaslan.com
- medmastery.com
- uptodate.com
- ecgpedia.org
- wikipedia.org
- Strong Medicine
- Understanding Pacemakers


