ECG
book.com
Making Medical Education Free for All
ECG
book.com
Making Medical Education Free for All
Home
/
ECG Waves, Intervals, and Segments
ECG waves, intervals and segments
Electrical Vector
Depolarization and Repolarization
Interval
Segment
Waves and Deflections
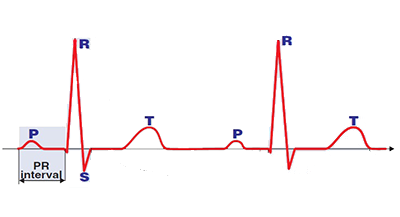
PQ Interval
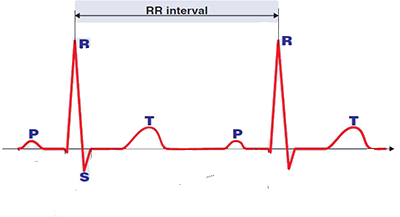
RR Interval
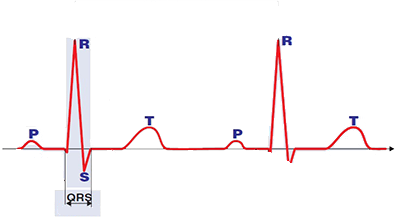
QRS Complex
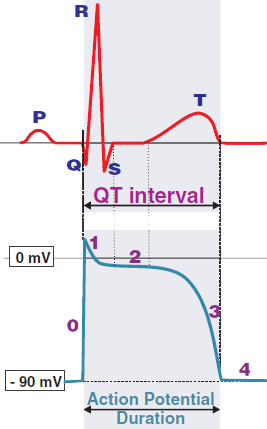
QT Interval
ST Segment
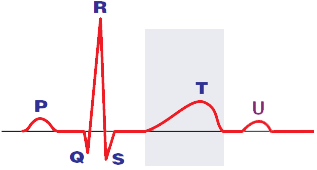
T Wave
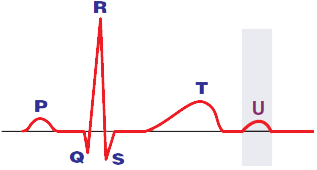
U Wave
Electrical Vector
On the
ECG, we only see
Limb leads
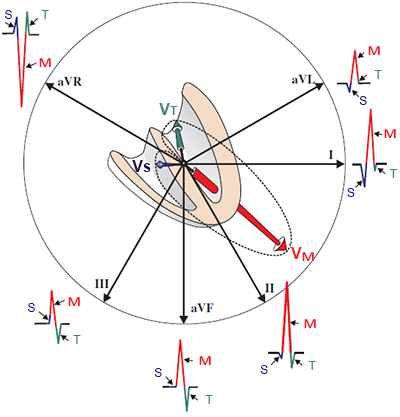
Electrical vectors
during
ventricular depolarization
The ventricles depolarize progressively
Ventricular septum (
V
S
- Septal vector)
Ventricles (
V
M
- Main vector)
Apex of the left ventricle (
V
T
- Terminal vector)
QRS complex
looks
differently in each lead
Because each lead
"views"
the vectors from a
different angle
If the vector points
Toward the lead
- a
positive deflection
occurs
Away from the lead
- a
negative deflection
occurs
Electrical vectors
are generated
in the
atria and ventricles
during
depolarization
and
repolarization
Depolarization and Repolarization
ECG records and displays
only the
electrical activity
of the
myocardium
not mechanical activity
not the electrical activity
of the
conduction system
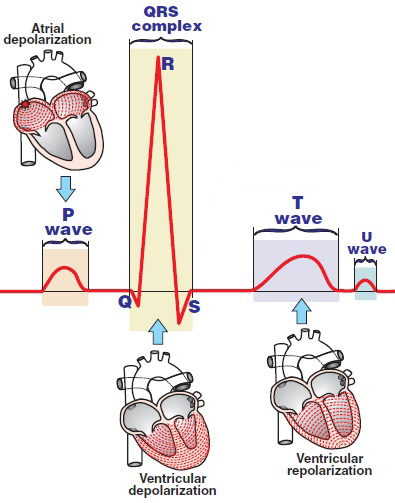
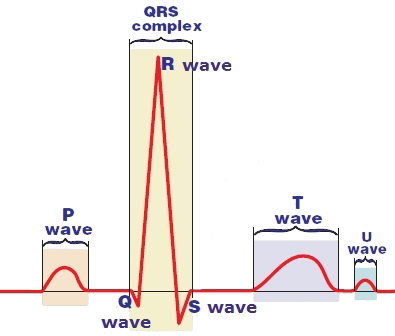
P wave
represents the
depolarization
of the atria
Ta wave
represents the
repolarization
of the atria
it is usually not visible, hidden within the QRS complex
QRS complex
represents ventricular depolarization
T wave
represents ventricular repolarization
Interval
An interval is a segment that
includes waves or complexes
Segment
A segment is a section that
contains only the isoelectric line
Waves and Deflections
Wave
is rounded
Deflection
has a sharp peak
Wave
In English, both
waves and deflections
are referred to as
wave
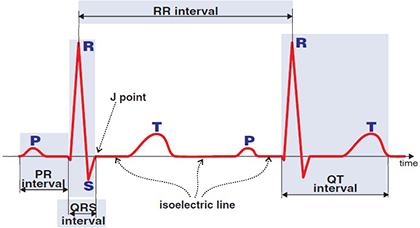
PQ Interval
Begins
at the
start
of the
P wave
(atrial depolarization)
Ends
at the
start
of the
QRS complex
(ventricular depolarization)
PQ interval
is sometimes referred to as
PR interval
Because sometimes the QRS complex starts with the
R wave
Duration is 0.12 - 0.2 seconds
It is the time during which the
impulse
travels from the
SA node
to the
ventricles
It is mainly used in the diagnosis of
AV blocks
RR Interval
Peak
of the
R wave
Is the moment
when the
ventricles are fully
depolarized
Depolarized ventricles create
the main cardiac vector
Used to calculate
heart rate
QRS Complex
Is sometimes referred to as the
QRS interval
The QRS complex
represents
ventricular depolarization
Ventricular depolarization
has
3 electrical vectors
Each vector has a different direction
Ventricular depolarization
is always referred to as the QRS complex
Even though it has a
different QRS configuration
(
RS, qR, Rs, R, rSR
)
The ventricles have a
more massive myocardium than the atria
This is why the amplitude of the QRS complex is larger
than the amplitude of the P wave (atrial depolarization)
Ventricular depolarization
(QRS complex) lasts 0.06s - 0.1s
QT Interval
Starts
with
ventricular depolarization
(QRS complex)
Ends
with
ventricular repolarization
(end of the T wave)
The QT interval
represents the
duration
of the
action potential
of the
ventricles
Has a
duration of 0.35 - 0.44s
Varies with frequency
, so the
corrected QT interval
is calculated
Prolongation risks
ventricular arrhythmia
Torsades de Pointes
ST Segment
Is the segment
between the end of the QRS and the beginning of the T wave
During
the
ST segment
No
electrical activity
is present in the
ventricles
The atria are relaxed
The ventricles are contracted
Preparing for
repolarization
The ST segment is a major marker
for
ischemia and infarction
T Wave
Represents
repolarization
of the
ventricles
Is
wide and low
Because
repolarization is slower and more asynchronous
Compared to
depolarization
The T wave
is the
most variable part of the ECG curve
Normal T wave
is
concordant
Has the same direction as the QRS complex
U Wave
The U wave
follows
the T wave
The mechanism of its formation is uncertain
It is probably due to delayed repolarization of the ventricular septum
Not always present
Often appears in cases of
hypokalemia
Sources
ECG from Basics to Essentials Step by Step
litfl.com
ecgwaves.com
metealpaslan.com
medmastery.com
uptodate.com
ecgpedia.org
wikipedia.org
Strong Medicine
Understanding Pacemakers